Lab Overview
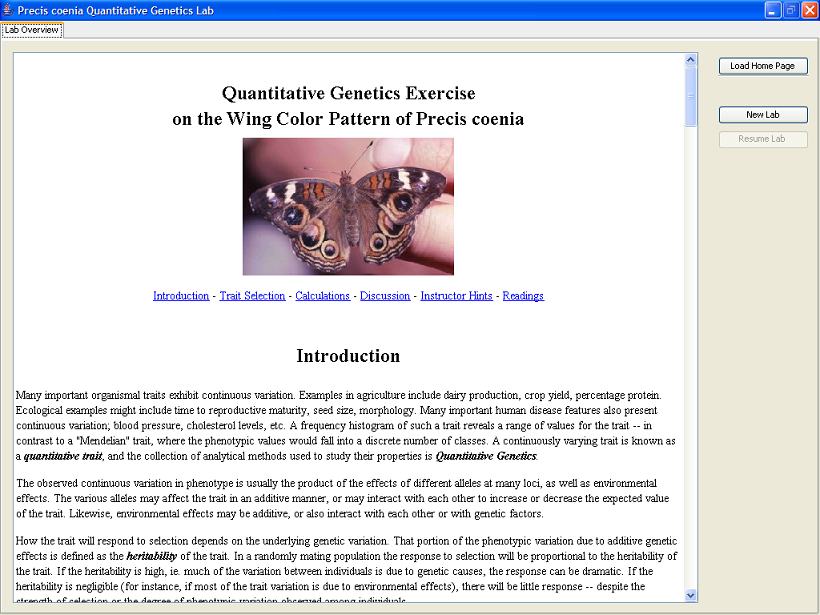
After you start the program you should see the Lab Overview Screen:
Please read the lab material in the information pane. The pane operates like a web browser. Navigate the material using the links provided in the material. You may return to the initial (or home) page by clicking on the Load Home Page button. The material presents several images of the wings that you could potentially be measuring. Use those images to determine interesting traits to measure.
When you are ready to start the lab, click on the New Lab button. The Resume Lab button is presented when an unfinished lab is present. This can happen if: (1) You exit a lab in the middle of making measurements and then restart the lab at a later time, or (2) If someone else did not complete their own lab.
If it is your lab, you may click the Resume Lab button to continue with the lab. If you know that it is not your lab, you should click the New Lab button to start a new lab, so that you will be completing your own lab, and not someone else’s lab.
Lab Setup Screen
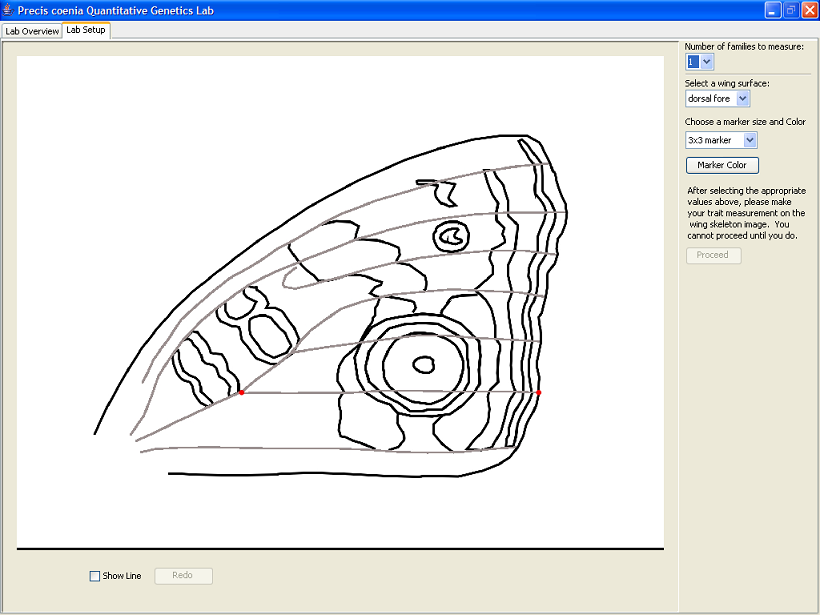
After clicking on the ‘New Lab’ button, you should be taken to the Lab Setup Screen:
This is the screen at which you will set up the Quantitative Genetics Lab that you will be performing. The initial image you see will have 2 red dots on it, which is the wing surface measurement. On your subsequent measurements, you will measure the wing size yourself by clicking on the wings in the same location as where these wing size measurements are now.
On this screen there are options to choose the number of butterfly families you will be measuring, the wing surface you will be choosing to measure, the size of the points you desire to use (the points that show up on the screen when you make your measurements), the color of these points, and also whether or not you wish a line to appear between your data points. To change the number of families, wing surface, or size of the data points, simply click on the combo box on the right side of the Lab Setup Screen, and choose what point size/surface/number of families you desire. The expanded wing surface combo box is shown here:
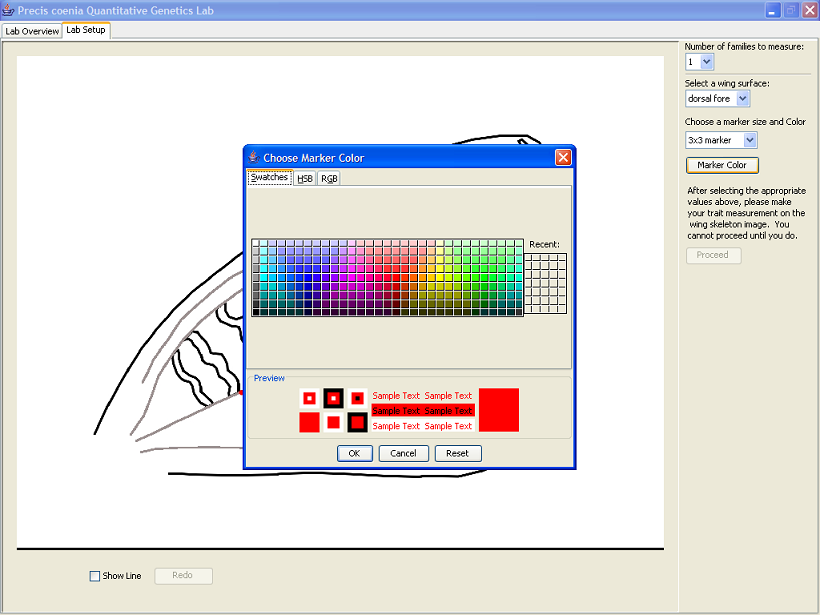
After you choose the number of families, the wing surface, and the size of your data points, you can choose to change the color of your data points if you so desire. This is done by clicking on the ‘Marker Color’ button, which will produce a dialogue box that will allow you to chose your marker color, as shown here:
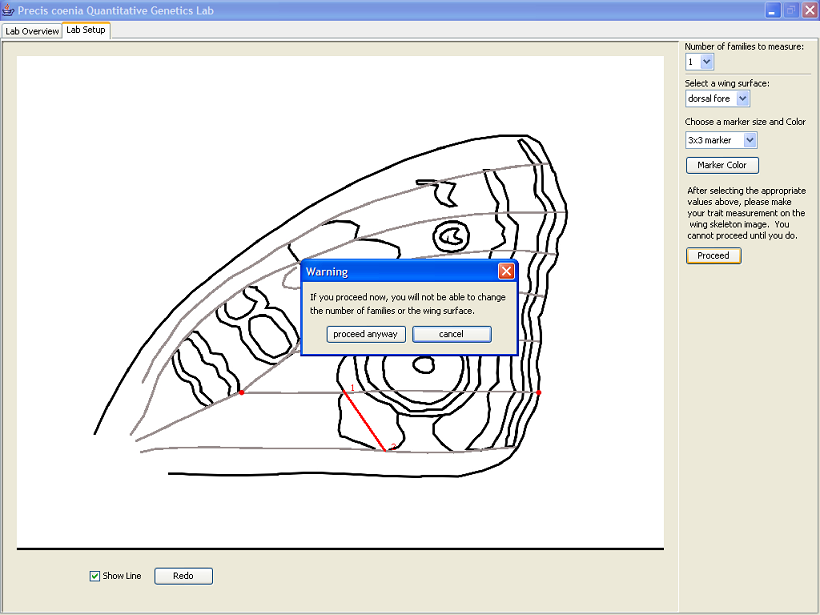
Once you have completed these steps, you are ready to perform your first measurement. Simply click the mouse on both ends of the trait that you wish to measure, to set a reference for you in case you forget which trait you are measuring during the actual lab itself (you will be able to come back to this setup screen to look at your initial measurement, change the marker color, change the size of the marker, and also choose the presence/absence of a line between points). An example is shown below, with the ‘Show Line’ checkbox checked as well (if this box was not checked, there would not be a line between the points):
You will now noticed that, since you have made your trait size measurement, that both the ‘Redo’ and ‘Proceed’ buttons have been enabled. Clicking the ‘Redo’ button will remove your last data point, allowing you to change the trait you are measuring if you wish. If you do click the ‘Redo’ button, however, the lab will not allow you to click the ‘Proceed’ button until both data points have been clicked and are present on the image. Once you feel that you have made the correct measurement, click the ‘Proceed’ Button, and a dialogue box will appear:
If you feel that you are ready to move on to the next section of the lab, click the ‘proceed anyway’ button, and you will be taken to the lab measurement screen, where you will be making the data measurements for the Quantitative Genetics Lab.
Measurement Screen
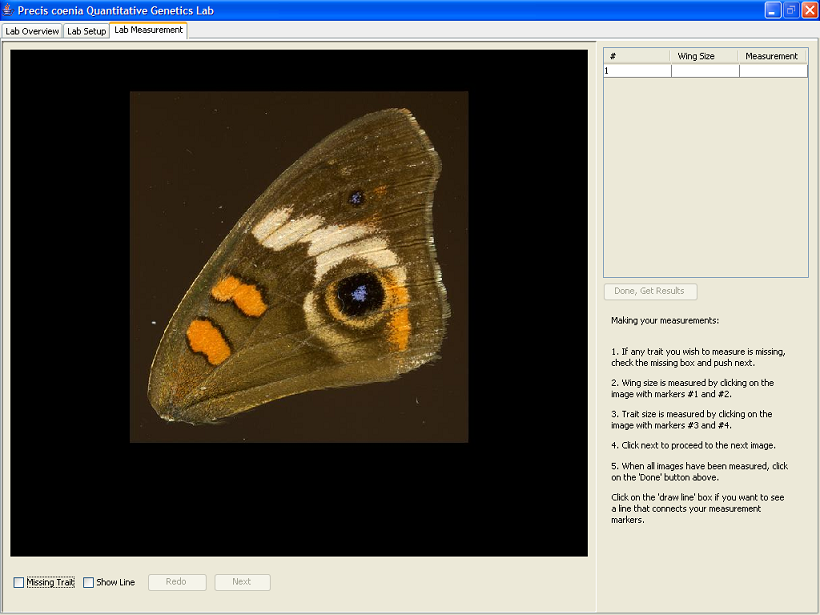
After selecting the traits you want to measure, you should see the Measurement Screen:
This screen is used to both measure sample wing images, as well as to display the data that you have gathered.
Upon beginning this section of the lab, note that there are 3 main areas on this screen:
- the wing image itself
- the measurement table
- a button section, with buttons labeled ‘next’ and ‘redo’, and checkboxes allowing for missing traits and to toggle between seeing the points with a line connector and without
Each of these sections will be explained in detail within this manual.
Data Capture
The purpose of this lab is to measure the size of the same trait across multiple wings, gathering both a baseline measurement for the wing size itself, and the distance measurement for the trait being measured. Make sure that the baseline that you are measuring passes through the trait being measured, as this is an important factor in the accuracy of your results. This is accomplished using a total of 4 left-clicks of the mouse on the wing image, and then followed by clicking the ‘next’ button.
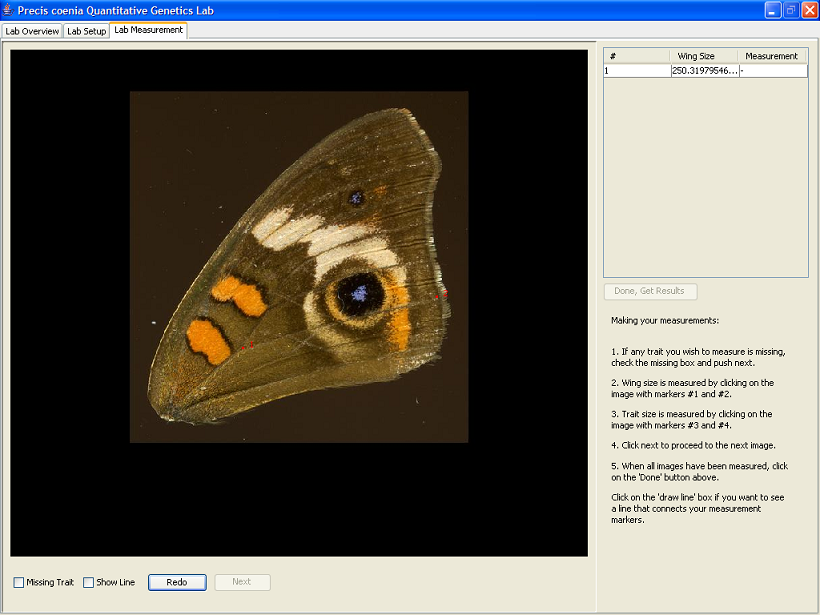
The first 2 clicks should be the beginning and end of the baseline wing measurement. These clicks can be made in any order (i.e. you can click the point on the right side of the image first and then the left, or vice versa), but must be of the baseline wing measurement. DO NOT measure the size of the trait first. A sample measurement is shown below:
(In the lab setup section, you will be able to choose the color of the measurement dots you see, and you can choose whether or not you would like a line to appear between the points on the panel underneath the wing image, using a checkbox.)
Now that you have made your baseline measurement, you should notice that the measured distance should appear in the table on the right side of the screen, as shown above. After making the baseline measurement, the next step is to measure the trait that you are observing. Measure this trait in the same manner as you took the baseline measurement, using 2 left clicks, one at one side of the trait, and the other click at the opposite side. Your measurement may look something like this:
(Again, dot colors and the presence/abscence of a connecting line are variable)
Congratulations! You have successfully completed your first trait measurement. Again, you should see your measurement value appear in the data table on the right side of the screen, as shown above. If you do not think that your measurement is accurate, or you misplaced one of the data points, simply click the ‘redo’ button at the bottom of the screen, and the last point you measured will be deleted, allowing you to redo that measurement. For example, in order to replace your second data point, you will have to redo the last 3 data points you measured, so click the ‘redo’ button 3 times. (Clicking ‘redo’ will not restart the entire lab, only the last data point measured)
Once you feel that your measurements are correct (make sure you have 4 data points, and 2 values in the data table), you should notice that the ‘Next’ button has been enabled. Simply click on this button to go to the next image that you will measure. (Note: once the ‘Next’ button has been pressed, you will be unable to remeasure the image you are currently on, so make sure that your data points are correct!) This result is shown in the image below:
Once you have measured all of the wings in the lab, a ‘Done-Get Results’ button will be enabled on the data panel on the right side of your screen, and a message saying that you have completed the lab will appear in the measurement panel. You should see a screen like this:
Simply click the ‘Done-Get Results’ button to advance to the next screen, which will allow you to choose the name and file type of your data results (CSV recommended), and the location to where your data output should be saved.
Getting Your Data
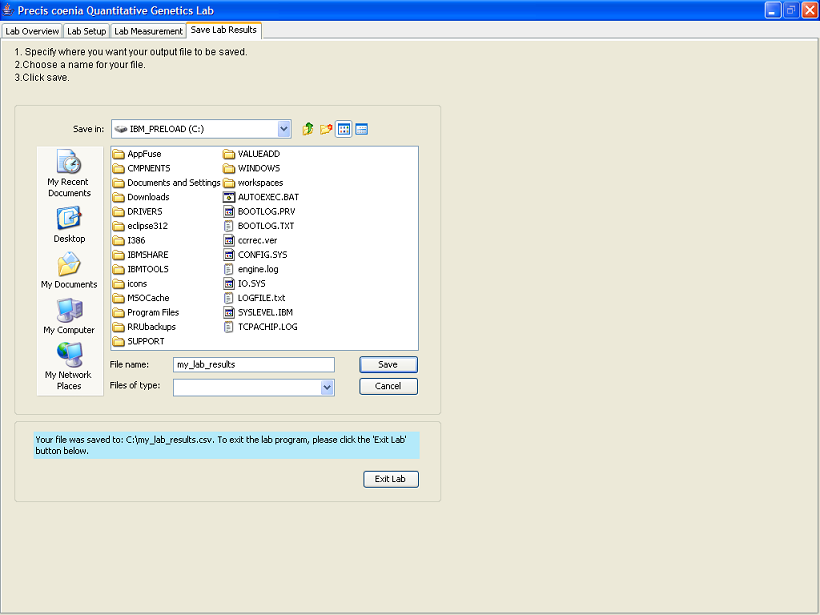
Once you have completed your data measurements, you should be taken to the Data Output Screen, which will look like this:
Your file will be saved to the location indicated by the ‘Save in’ field with the filename specified by the ‘File name’ field. ‘.csv’ will be appended to the file name. This indicates that the file is in ‘comma separated values’ format, which will allow programs like Microsoft Excel to read in your data and output a spreadsheet, which you can then use to perform your data analysis on.
Click the ‘Save’ button to save the file to your filesystem. Once the file is successfully saved, the system will be reset. The ‘Exit Lab’ button will be enabled once the file is saved successfully, and a dialogue will appear at the bottom of the screen, as shown in the image below:
You will still be able to view the Lab Setup and Overview Screens by clicking on the tabs at the top of the screen. The Lab Intro Screen, specifically, has information that is useful for your data analysis, so you may want to take a final look at the Overview Screen before you exit the lab. Once you feel that you are ready to finish the lab, click the ‘Exit Lab’ button to exit the lab software.
