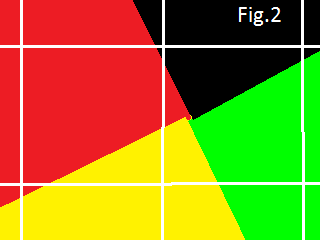
To the left u > Viso = 0.5 in the red and yellow regions (the red color = 1) and ∂t u > 0 in the green and yellow regions (the green color = 1). Therefore the tip is the point where four colors meet together.
In 3 seconds the script begins to plot the path of the spiral wave tip (a small cycloid).

|
"One practical way to identify the spiral wave tip in 2D is
to arbitrarily choose a single isopotential line of constant
membrane potential, u(r,t) = Viso, where r is the
position vector, to represent the boundary between depolarized
and repolarized regions of the tissue, as when hand
drawing a spiral wave. The wave tip can then be defined as
the point where the excitation wavefront meets the repolarization
waveback of the action potential, or equivalently as
the point of zero normal velocity along this boundary...
this point is the intersection point of the
lines u = Viso and ∂t u = 0." [1]
To the left u > Viso = 0.5 in the red and yellow regions (the red color = 1) and ∂t u > 0 in the green and yellow regions (the green color = 1). Therefore the tip is the point where four colors meet together. |

| If ∂t u has different signs at the corners of a square, then the line ∂t u = 0 goes through the square. Therefore the simplest way to find intersection is to check, if both ∂t u and u - Viso have different signs (at the corners of a square). Next we can check if these two lines really have intersection (see Fig.2) as this script does. In 3D we test every small cube if its 8 vertices "have different signs". Next we could check its 6 faces if two lines really have intersection. |
[1] Flavio Fenton and Alain Karma Vortex dynamics in three-dimensional continuous myocardium with fiber rotation: Filament instability and fibrillationa. CHAOS 8, 1, 20-47 (1998).